Clearly identifying your customer needs is fundamental to a strong commercial engine, yet many manufacturers use legacy data and opinions rather than hard facts derived from sound research. Manufacturers have many pressing issues that need immediate attention. Concentrating on quality control, on-time shipment, and the supply chain, even to the detriment of keeping up with the changing needs of your customers in your best end markets, is natural.
Voice of the customer (VOC) research can be conducted in days by calling a few favorite customers or months (or quarters) canvassing your installed base. Finding the right scope can be hard. A quick study rarely delivers results believable enough to motivate your company into action, and an exhaustive study can drain too many resources and take too long. Manufacturers embarking on a VOC research project typically have three questions:
- Will the research results show where we can make improvements?
- Will my team believe the results to be credible enough to take action?
- Will the results be worth the time, money, and resource drain?
If you do it wisely, the answers are yes. In some cases, a solid VOC study can be the difference between business success and failure. The key is to take a scientific, fact-based approach.
Recommended VOC Approach
This VOC research approach is based on a system developed by Applied Marketing Science. It has the right blend of delivering highly effective output while retaining reasonable scope. The approach uncovers a comprehensive list of needs, gathered in a strategic way, listed in the customers’ own words, and organized and labeled by the customers themselves. When it is completed, you’ll have believable, actionable data that will motivate your team to take action and improve your offerings and services.
A comprehensive set of accurate customer needs is vital to the performance of many departments (Figure 1).
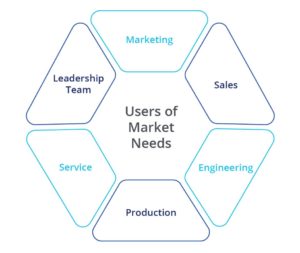
Figure 1. Departments that can utilize market needs data
What Will Be the Result of This Research?
The best way to get you fired up to conduct this research is to show you the end result. Figure 2 and Figure 3 depict the two primary deliverables of this research approach. They show the VOC deliverables for ABC Custom Truck Works, a fictitious company that manufactures custom vehicles for landscapers, electricians, and carpenters. These examples are specifically for its landscaper end market, though some of the needs are appropriate for other, adjacent end markets.
Deliverable No. 1—Primary Needs Table
The first deliverable you create will be the Primary Needs Table, Figure 2. The table includes three to seven need families (in this example there are three), and 12 to 25 primary needs (in this example there are 14).
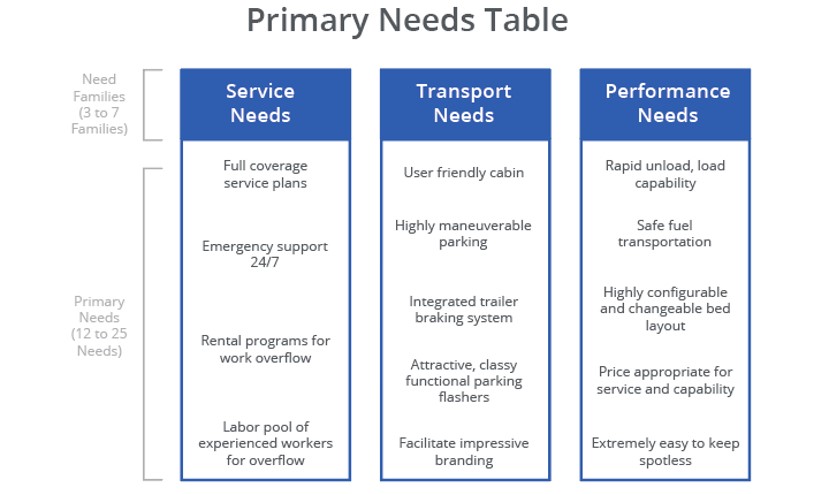
Figure 2. Primary Needs Table example
The Primary Needs Table provides an organized picture of your customer needs in a way that your company can easily understand. Most of the needs you uncover will not surprise you. Being surprised at what doesn’t make it onto the table is more common. The magic comes from knowing for sure that these needs are of prime importance to your customers and should be focused on first.
Deliverable No. 2—Market Opportunity Map
The Market Opportunity Map is the second major deliverable of the VOC research. This map places the primary needs in a 2 by 2 grid based on two criteria:
- The importance of each need to the customer.
- Your performance in meeting their expectations related to that need.
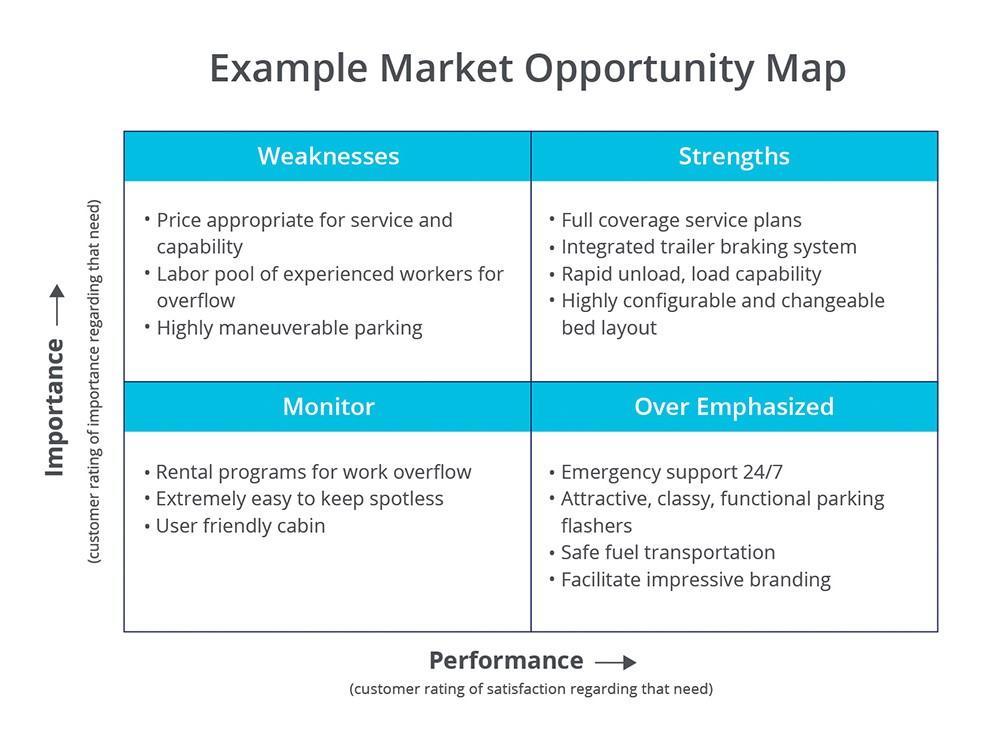
Figure 3. Market Opportunity Map example
The top left quadrant of Figure 3 shows areas in which ABC likely will concentrate first – where the importance of the need is relatively high and the company’s performance fulfilling the need is relatively low.
These two charts—the Primary Needs Table and the Market Opportunity Map—present a clear, concise, prioritized summary of the things your customers want. Download the templates here.
How Long Does the Research Take?
If you have the time and talent, this research can be executed without the help of outside resources. It typically takes approximately 16 weeks if you go it alone, and half that time with help from an experienced external partner. You can expect two people to work 20 to 30 percent of the time on the project, with other key stakeholders providing occasional support.
How to Conduct the Research
Let’s start with a general overview of the process that creates the Primary Needs Table and the Market Opportunity Map. The research involves recording interviews, pulling the needs from the transcribed interviews, and then having a few knowledgeable customers (yes, customers) group the needs into 12 to 25 primary needs to create your Primary Needs Table. These needs then are distributed in an email survey to as many users as you can reach in your target market, which enables you to create the Market Opportunity Map.
You’ll find scheduling the interviews and pulling the needs take the most time. In the end, you have a full set of primary needs in your customers’ own words and priority.
The Outline
- Establish project scope and obtain approval.
- Develop the VOC interview plan for the audience.
- Conduct the VOC interviews.
- Identify and sort the VOC needs to create the Primary Needs Table.
- Conduct the broad customer rating email survey to create the Market Opportunity Map

Figure 4. Five steps of the VOC research
Here are the details of the five steps (Figure 4).
Step 1. Establish project scope and obtain approval.
Create a scope document to plan your project and get leadership buy-in. Consider filling out each of these section headings:
- Purpose
- Target audience
- Background and assumptions
- Objectives and deliverables
- Tactics
- Internal and external resource demand
- Budget and ROI
- Timeline and milestones
- Reporting and signatures
Obtaining buy-in at the start helps you gain the confidence of others in your research approach and makes them more likely to fully endorse and use the research results.
Step 2. Develop the VOC interview plan.
The interview plan includes the number of people you will interview and their demographics. Determine the number of each type of customer and job title that will provide a cross-section of your target market.
How many interviews are required to obtain most of the needs? Surprisingly, research has shown that when proper interview techniques are used, 20 to 30 interviews are sufficient to gather more than 90 percent of customer needs. I recommend 20, as they will generate 400 to 1,000 needs that, upon scrubbing, will provide 75 to 300 unique customer needs statements.
Design an interview plan that includes the main influencers and important demographics. You want a good cross-section of the market. Consider job title, geographic location, application, or other categories that make sense for your business. Figure 5 shows an example interview plan for ABC Custom Truck Works. ABC is located in New Jersey, and also covers parts of New York and Connecticut. The key influencers in the purchase and usage of its products and services are operators, managers, and owners.
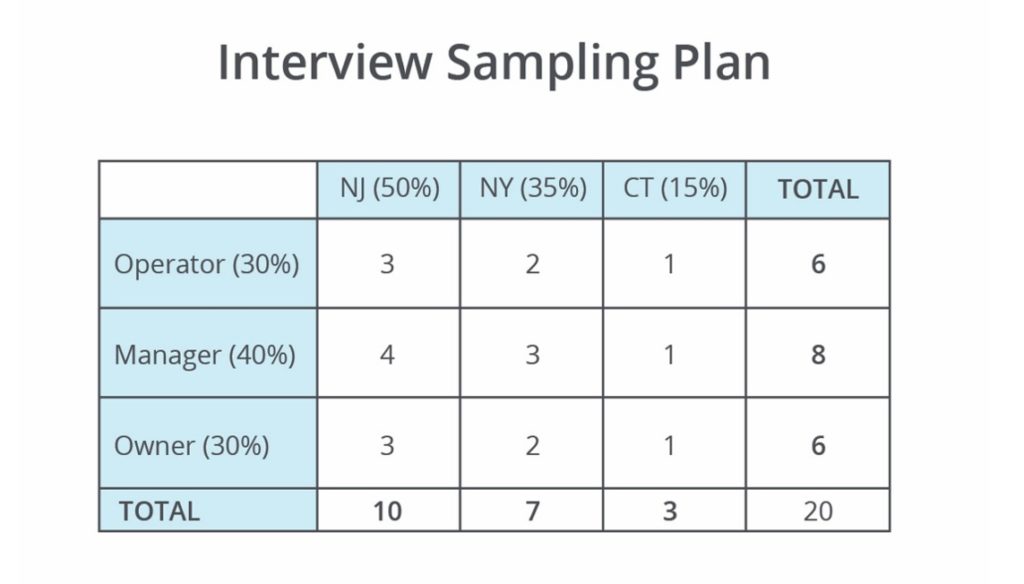
Figure 5: Sampling Plan example.
The next step is to add contact names to each of the cells. As much as possible, use random sampling to select your target companies with one exception: try to include several early adopters, highly enthusiastic, or highly innovative customers. These interviews often are important sources of needs because these customers typically have a strong desire to maximize the performance of your offering. You might find that some cells are hard to fill, but do your best to stick to your interview plan. For 20 interviews, start with a list of 80 to 100 names.
If you are addressing more than one market or product but feel they can be combined into a common interview pool, include an additional 10 interviews per market or product segment. Track the responses from each segment separately so you can highlight significant differences. Download the template here.
Step 3. Conduct the VOC interviews.
In Step 3 of 5, interviews are recorded and transcribed. Recording ensures you capture the customers’ own words and frees you from taking notes.
I use TapeACall to record the call on my smartphone, and then Rev to obtain a transcription. Many services are available. In your introductions, be sure to tell the customers the discussion is being taped, that recording allows an open discussion to take place without being slowed by note taking, and that the recording will only be used internally.
You need at least 30 minutes per interview. I typically ask for 45 minutes, knowing that some will stretch to an hour. Two people should conduct the interview, one to act as the main interviewer and the other to jump in to dig deeper if an opportunity is missed by the main interviewer. The interview technique involves following a conversation thread with open-ended questions. You are not conducting a yes or no survey; you’re seeking customer needs stated in the customer’s own words.
Here’s an example to help illustrate the interview question technique:
“Do you prefer A or B?”
Close-ended question, merely used to set up the discussion.
“Why do you prefer B?”
Open – might uncover a new need, or simply identify the reasoning for selecting one product over another.
“You mentioned you prefer B because it is faster. Can you explain your need for speed?”
Open – following a thread of the conversation digs deeper to uncover the true need. Continue following this speed thread. For example, if they mention they need speed to avoid bottlenecks in their production line, ask additional probing questions around issues pertaining to production bottlenecks.
Prepare 10 to 20 general questions, with in-depth follow-up questions for each in the event the customer doesn’t understand or gives a quick reply – especially if you are speaking to someone who is in a position to provide more information. Use the same template for all customers, but the questions you actually use depends on how the interview plays out.
When the customer expresses a need, dig in to explore it fully. Stay flexible. Omit questions or take them out of order if necessary. You are in search of needs, not trying to get through a list of questions. The interview guide is meant to be an aid, not a constraint. Expect to ask questions that occur to you during the conversation, even if they are not in the guide.
Use simple questions to begin. Loosely follow chronologically, starting with the customer’s first use of the product and moving to the present state. Start by asking about extremes such as “best” and “worst.” Get your customer talking and follow conversation threads that seem to be uncovering needs.
When you’ve concluded these three steps, you will have 20 or more transcribed interviews full of customer needs. You and your co-interviewer probably will find conducting these interviews fascinating and fun. You also will find that some were full of valuable needs, and some were busts.
These last two steps are where the rubber meets the road. The steps describe how to turn your taped interviews into your Primary Needs Table (Figure 2), and then how to conduct the online surveys to create the Market Opportunity Map (Figure 3).
Step 4. Identify and sort the VOC needs.
At the conclusion of Step 3, you have written transcriptions of all interviews. Now you must extract the needs from these transcriptions.
As you work your way through the printed transcriptions, identify all needs phrases, highlight them in the transcription, and copy them onto a spreadsheet. It is best if two people work independently to pull needs from each transcript; this ensures a thorough scrubbing. Duplicates are removed later.
Look for needs that are characteristics, such as “Quick loading and unloading of equipment,” or solutions, such as “Give me a button on the dashboard that does this,” or target values, such as “I want to unload equipment in 30 seconds.”
Look for opinions, such as “It takes too long to get the equipment unloaded,” and for clearly articulated wants, such as “I want to increase productivity and not waste time loading and unloading my equipment.”
Needs and usable comments come in different types. Some are ingredients for the Primary Needs Table, and some are not.
Qualitative needs for ABC Custom Truck Works (a fictitious company that customizes vehicles for the landscaper end market) might include phrases such as these:
- We must have enough fuel to get us at least through lunch.
- The equipment we carry varies a bit each month, so the trailer must accommodate these changes.
- I need to unload my equipment fast.
- Avoiding injury during equipment loading is key. This is when injuries tend to happen.
- Maneuvering into parking often is difficult and wastes time.
Remove duplicates, solutions, and opinions. Your goal is to develop a list of “pure” qualitative needs, devoid of duplicates, target values (“I must have 10 of each”), solutions (“If you could just redesign the widget to be thumb-operated…”), and opinions (“Blue is cool”). Target values and solutions and opinions suggestions should be put to the side. This information is valuable to product development and service departments’ continuous improvement efforts, but does not constitute primary needs.
Duplicate responses are removed because repetition doesn’t necessarily correlate to importance. It might simply correlate to being obvious. Step 5 prioritizes the importance of the needs relative to each other.
Review the phrases on your spreadsheet. If a customer’s words perfectly describe the need, leave the phrase in quotes and do not change them. Quotes will be helpful when it comes time to use the results for content copy (with the customer’s permission, of course). Quotes also prove to your company that you left the needs in the customers’ own words where possible. If the customer’s wording is not clear or is too lengthy, then rephrase the comment and remove quotation marks.
Your list of 400 to 1,000 needs pulled from the transcripts typically ends up to be 75 to 300 final qualitative needs. Now it’s time to create the all-important Primary Needs Table list of 12 to 25 primary needs in three to seven families. ABC’s example is shown in Figure 2.
To create the primary needs table, print each need clearly on a slip of paper so that it can be easily handled. Bring in a review team of two or three well-informed customers, and conduct the sorting exercise in which they place the needs into related groups. You will need to be with them to help them along. If you are unable to recruit customers, use knowledgeable individuals from within your company, but only as a last resort. Using customers instead of your own staff removes biases and keeps results truly customer-driven. This step takes about an hour.
Before you have customers perform this sorting exercise, I recommend you show them a finished example (such as Figure 2) so they understand the goal of the exercise.
Have the reviewers sort the needs individually, compare results, and then finalize together. They often choose to start over when they work together for the final set. Instruct them to look for needs that “go together.” Divide large groups of needs into smaller groups. Some may have only one or two needs, and that is acceptable at this point. Later, help the reviewers place these outliers with another needs group when the exercise is completed, or leave them separate if they truly represent a unique customer need.
Have the review team create a label that summarizes each needs group and continue until they have 12 to 25 primary needs grouped into three to seven families. It is important that the reviewers doing the sorting create the primary needs label and family header so that terms reflect the customers’, and not the supplier’s perspective.
When finished with this step, your customers will have created your Primary Needs Table of Figure 2. You now have a comprehensive list of primary needs grouped into families. It was created by a careful process, delivering objective results, and you now have a clear picture of your target end market. You have revealed many needs you expected, and others might be a surprise.
As a reminder, retain the numerous specific needs that comprise each primary need to be leveraged for more detailed analysis later. Many of these needs are in the customers’ own words and provide great insight. If one of the primary needs was, for example, “Emergency support 24/7,” then the individual needs that comprised that group will be helpful when the service team looks to improve its emergency support programs.
The Primary Needs Table example for ABC Custom Truck Works (Figure 2) shows three families of primary needs related to service, transportation, and performance. These three families comprise a total of 14 primary needs.
Step 5. Conduct the customer rating survey.
You can gain even further insight by conducting one more exercise to create the Market Opportunity Map of Figure 3. In this final step, survey a large customer audience via email and have them rate the needs from 1 to 10 on two factors:
- The importance of that need to them.
- Your performance in delivering that need.
Normalizing and graphing the data result in a powerful visual map, as shown in Figure 3, which is an example from ABC Custom Truck Works.
Email the survey to a group large enough to ensure 50 to 300 responses; the more responses the better. Be sure to cover a comprehensive cross section of your target market.
The process for conducting the email survey includes finding an online survey company, creating the email survey, sending out the survey, and scrubbing the data.
Find an online survey company. If you’re surveying a global market, select a vendor capable of handling an international program. Translate as needed. Always track the survey recipients so you can sort the results based on demographic variations.
Some companies that conduct these types of surveys are Survey Monkey, Typeform, Google Forms, Zoho Surveys, Survey Gizmo, Survey Planet, Campaign Monitor, Zoomerang, GetFeedback, Checkbox, eSurveysPro, SoGoSurvey, and FluidSurveys.
Create the email survey. Use best practices in the email design to help ensure high open and click-through rates (see Solution 4, Generating More Leads, in our book for advice, or search Google under “email best practices”). Ask each respondent to rate your final 12 to 25 primary needs. For each need, you’ll ask them to respond to two survey questions:
- On a scale of 1 to 10, with 10 being most important, how important is this need to you?
- On a scale of 1 to 10, with 10 being outstanding performance, how does the product you are currently using perform regarding this need?
Send the email survey. Send the survey to as large an audience as you can within your target market. The response rate to your email survey depends on many factors, such as your end market, the title of the person you are trying to reach, and the closeness of the relationship you hold with that customer. You can expect a 2 to 5 percent response rate. Increase the response by providing an appropriate incentive (if allowed), or calling ahead to alert the customer of the email and your hope that they take a few minutes to participate. Incentives and pre-calls can raise your response to 8 to 12 percent. Use the same email best-practice techniques you would for a marketing campaign.
Scrub results and normalize the data. Once you have your data, build your Market Opportunity Map (Figure 3). The map provides a clear picture of the areas of strength that you should promote more heavily, along with areas in which you should improve your offerings. It illustrates the priorities that are truly important to the target market.
Scrub the results by eliminating responses that follow any pattern that suggests the respondent did not take the survey seriously (all tens, all ones, alternating 1 and 2, etc.).
To place the needs into quadrants, normalize the data so it plots correctly on a 2 by 2 grid (Figure 4). To normalize the data, make the Y axis min and max equal the smallest and largest average number of any importance rating, respectively. Repeat this for the performance ratings on the X axis. If you have 25 primary needs, you will plot 25 points on Figure 4, delivering the results in Figure 5. With the needs plotted, add in the two lines to divide the quadrants. For example, the numbers 8, 9, 8, and 3 have a max of 9, min of 3, and a midpoint (not average) of 6. For assistance, download the template titled “Graphing the Marketing Opportunity Map.”
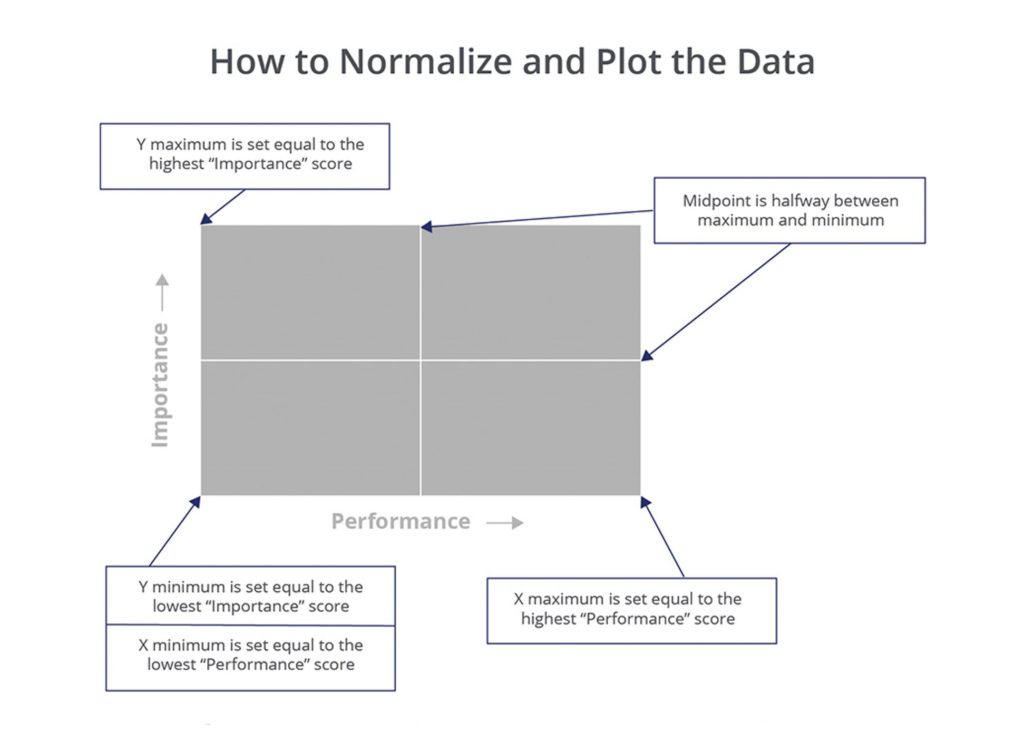
Figure 6. Normalize the survey results
Figure 6 shows the results of plotting the average value for each of the 12 to 25 primary needs of ABC Custom Truck Works’ market.
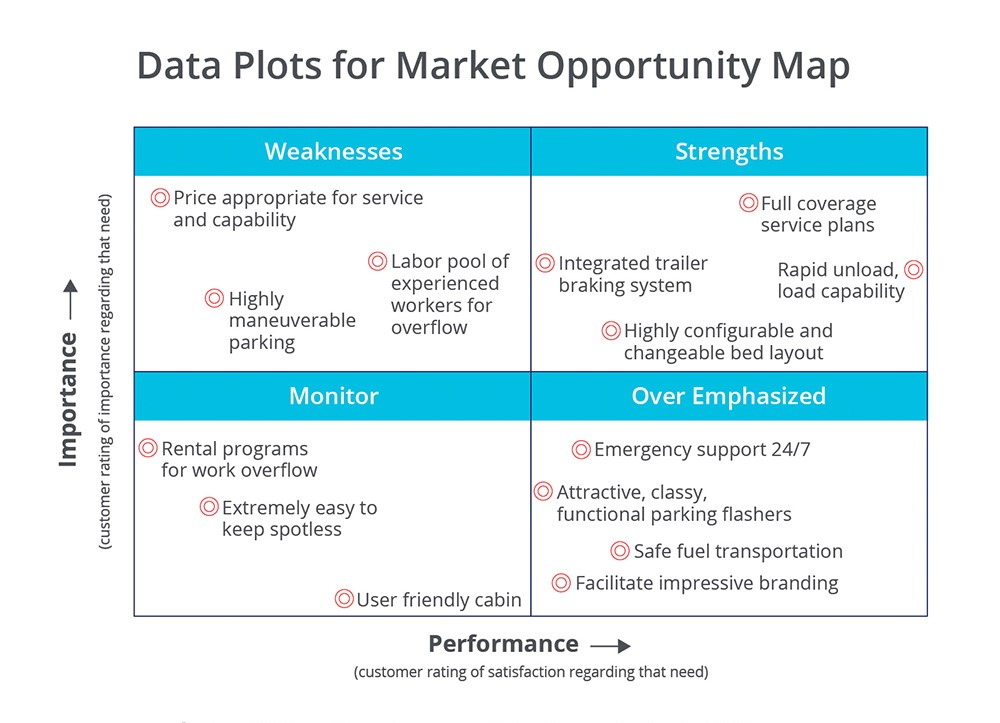
Figure 7. Plot the data
Some needs are on the borderline of moving from one quadrant to another, and others rank very low in importance. Both results are normal and acceptable. In the example, ABC Custom Truck Works should not disregard “User-Friendly Cabin” simply because it rated the lowest in importance. All primary needs are important. Perhaps 10 percent of potential customers in ABC’s market won’t buy a vehicle if it doesn’t have a topnotch, user-friendly cabin. The Market Opportunity Map simply shows how needs relate to each other.
The plotted version of Figure 7 typically is not shared with anyone outside the VOC research team. It’s better to show the data represented as shown in Figure 3 to your company departments.
ABC’s completed Primary Needs Table and Market Opportunity Map (Figure 8) present a clear picture of target market needs and priorities. If appropriate, they can complement this research with ethnography. When applied to marketing, ethnography pertains to observing how customers use a product or service.
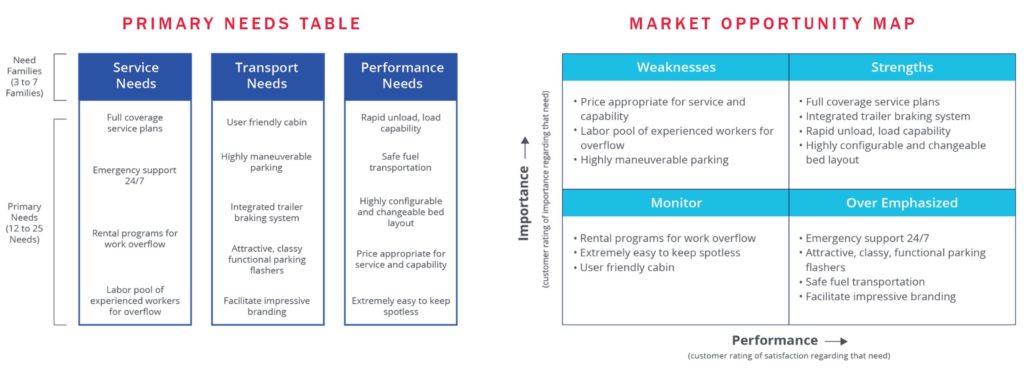
Figure 8 The end result (Figure 2 and 3 are repeated here for convenience)
ABC now is armed with believable customer data that can be used by many departments to significantly improve their business performance. The company should consider repeating this formal research every three to four years. With the VOC process completed, ABC’s research team prints copies and presents the findings to the organization, inspiring a spirit of continuous improvement.
With the powerful VOC research results in hand, your company can move forward with full confidence.
Along with this post, Fairmont has created a free webinar. This webinar will offer more details and offer an opportunity to clarify your specific questions. It took place March, 2018. Click Here to download.
Latest posts by Chip Burnham (see all)
- Value Pricing Retains Both Customers and Profits - November 14, 2018
- Voice of the Customer – Needs Research - October 17, 2018
