
When we ask a small to mid-sized company if they know who their best customers are, they always reply that they do. When we ask how they determine their best customers, most say the same thing: the ones who deliver the highest revenue. And which customers do they most want to find? Those that generate the most revenue.
Unfortunately, there are two serious flaws in this strategy. Top revenue generating customers are not necessarily your most valuable and your best customers are not always cloneable.
So, if you don’t go after the customers who can deliver the highest revenue, who should you target? First you must define your “best customer” and then you have to hunt for them in the markets where they are most likely to reside.
Selecting the best end markets is vital to a company. After all, it dictates company infrastructure, staffing, products and strategy. Mining your best end markets is the most important aspect in driving your commercial engine to peak performance.
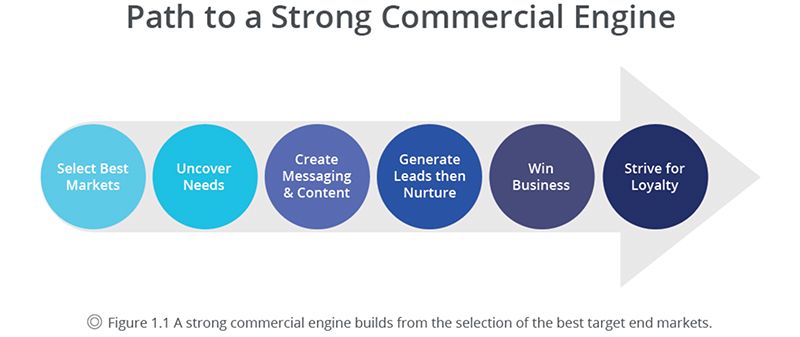
The commercial engine encompasses everything from generating leads to obtaining loyalty. To create a healthy commercial engine, you must take these two critical actions:
- Select the target end markets that will bring you the most value.
- Select the target end markets big enough to fuel sustainable business and growth.
Here are five key steps toward successfully accomplishing both:
1. Identify customer value
Identifying true customer value can be tricky. I’m sure you’re familiar with the drill – your company’s biggest customer generates lots of revenue but is a massive resource drain. Every order they place brings on a barrage of problems that don’t stop with the product shipment. You begin to wonder if the high warranty cost, management time, and special modifications leaves any money at all on the bottom line.
And that is exactly the right question to ask.
Every company can quickly identify the revenue and gross profit of each customer. You simply look at what they paid for a product or service, and then deduct the cost of goods (COGS) and you’re done. But what about other – less obvious – expenses? The income statement doesn’t stop at gross profit. You still must deduct other expenses before you get to bottom line income.
Revenue
– Cost of Goods
– Expenses
Income
To truly determine the value a customer brings, you must consider the total cost to serve. What resources in engineering, marketing, sales, service, management, senior leaders, and warranty are actually spent servicing this customer.
You might be saying, “That’s nearly impossible to do.” And I agree. But there is a way to approximate it that provides you with enough information to make the right decisions when it comes to choosing which prospective customers to go after.
This process provides a way to compare top customers against each other to see which provide the greatest value to your company. The technique is to compare what I call the Pocket Income of your average customer against the estimated pocket income of a single customer. Here’s how.
2. Identify your best customer candidates
Have your finance department create a list of the customers who provide the top 20 percent of your revenue. Use a two-year average to smooth out spikes and lulls in business activity.
You can add in a few other customers you are particularly interested in analyzing who don’t make the top 20 percent. You should also remove any customers who yield an especially low gross profit percentage. For example, if a customer brings in $250,000 a year in revenue, but has a COGS of $230,000, then the gross profit percent is so poor that they are not worth analyzing.
3. Calculate your average pocket income
Once again, have finance provide the average revenue, COGS, expenses and net income for all customers combined. This should be relatively easy to obtain since it is just a simplified income statement.
Based on budget allocations, have finance estimate the expenses (including labor) of each of the following departments: marketing, sales, service, engineering, production, management, leadership, and warranty. If you have other departments such as sustaining engineering, product management, or others, either include them individually or roll them into one combined number.
Using these numbers, you will be able to calculate the pocket income for your average customer as shown here.
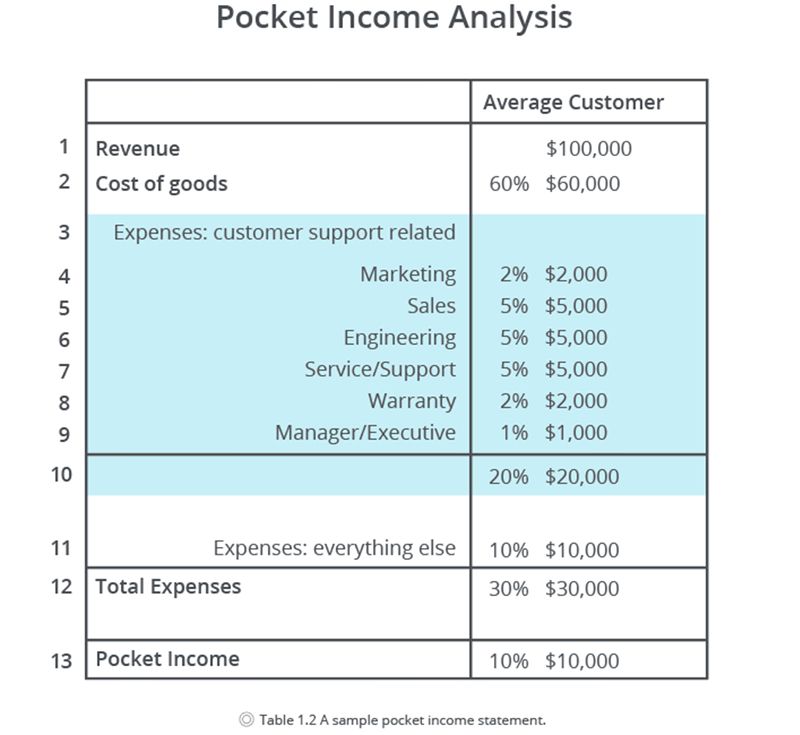
Notice that the only difference between the pocket income statement and a typical generalized income statement is in the breakdown of the expense section. In rows 4 through 9 the department by department cost to serve for the average customer gives you the information you need to analyze individual customers. Fixed expenses that don’t change with an increase or decrease of revenue (i.e., utilities, rent, salaries, insurance, depreciation) reside in row 11.
4. Compare selected customers against the average
You are now able to compare your selected customers to the overall company averages you have calculated. The group selected in Step 2 is made up of your top revenue generators, but now you will estimate the cost to serve and see which ones are really the most valuable.
To do this, have every department manager evaluate each selected customer and determine whether they require more or less resources to service than the average customer and by how much. Your managers will adjust the percentages of Rows 4 through 9.
- For example, here is how a service manager might adjust percentages based on a customer’s resource drain on the service department.
Beta Corporation brings in approximately the same revenue as the average customer. The service manager asks the question, “Does Beta Incorporated require more or less resources from my department than the average customer?” The average service drain for all customers is five percent. The service manager subjectively decides that Beta generates twice as much support activity as the average customer so she plugs in 10 percent on the expense line for her department. If she determined that Beta required only half the resources of the average customer, she would have entered 2.5 percent. - Alpha Corporation brings in twice the average revenue. In this case, the service manager asks the question, “Does Alpha Corporation drain twice the resources of the average customer since they generate twice the revenue.” The service manager makes the subjective decision that they don’t drain any more than the average customer. Therefore, she enters in a service drain percentage of 2.5 percent, half the average customer.
Each manager goes through the same process until all the target customers’ expense percentages are adjusted.
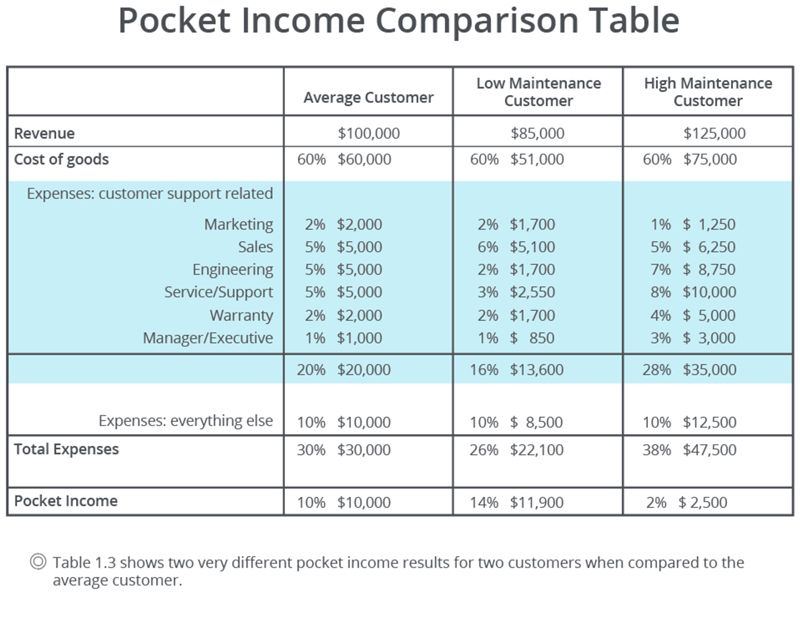
In this example from the MarketMD Your Manufacturing Business book, we look at two different customers, one is a low maintenance customer and the other is a high maintenance customer.
Low Maintenance Customer: Low Maintenance Customer brings you near-average revenue compared to the average customer ($109,000), but because their expense drain is low they contribute a higher than average pocket income of 14 percent. This is a highly-satisfied customer that demands few engineering resources. They have imbedded your product so deeply into their own products and systems that they are committed to the partnership with you and are unlikely to change. They have trained their own staff to service and maintain your equipment and only come to you under unusual circumstances. Sales spends slightly more time with them than with the average customer, but there is no increase in management or marketing expenses versus an average customer. Clearly, this is an ideal customer. Make note of their end market segment.
High Maintenance Customer: High Maintenance Customer looks favorable at a quick glance. Their high revenue and typical COGs percentage suggest they generate high gross profit, but the pocket income analysis tells another story. High Maintenance Customer is demanding and unreasonable. They drain significant resources from your technical support team, managers, and executives, costing significantly more in time and money than the Average Customer. The constant barrage of service demands, product changes, and executive interaction drives up your cost to serve this needy customer.
While both customers look attractive in terms of revenue and gross profit margin, High Maintenance Customer provides little pocket income. Low Maintenance Customer, on the other hand, has low resource and warranty drain, so their pocket income is significantly higher than average. Pursuing clones of Low Maintenance Customer in their end market should be a high priority. Chasing clones of High Maintenance Customer will likely drain resources and profits.
Pocket income analysis will identify the types of customers that are best for your business and help you avoid the ones that aren’t.
5. Evaluate market viability
Now, before you jump to the conclusion that the customers who delivered the highest pocket income point to the end markets you should target, you need to evaluate market viability.
Does the end market where the top customers reside have enough prospects to sustain and grow your business? You don’t want to try to find clones for your best customers if those clones don’t exist. You need to ensure you pursue viable markets.
Let’s say you found six customers who deliver well above average pocket income, and you consider them candidates for end market selection. You first must look within your CRM for any customers who are in the same end market as your six candidates. Run the pocket income analysis on those customers to see if they too are providing good pocket income. Remove any of the six final candidates if you find that other similar companies in your CRM are providing below average pocket income.
For the remaining candidates, conduct a market sizing exercise by examining the Service Available Market (SAM) and Service Obtainable Market (SOM).
Only a portion of your SAM – your SOM – can be mined for business today. However, since your competitors are already addressing the SAM, you should assume that, with some product development, you can access some of the SAM in the future.
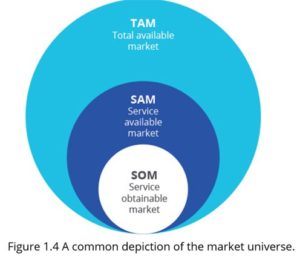
Sidebar: Common definitions of TAM, SAM, and SOM
Total Available Market (TAM) is the entire prospect universe for all your products and those of your competitors now and in the future.
Served Available Market (SAM) represents available markets which realistically can be reached by your organization and those of your competitors.
Serviceable Obtainable Market (SOM) is the subset of SAM you believe you can reasonably capture with your business structure and products.
Anyone can hockey stick an opportunity line graph and jack up future sales predictions by simply using the Total Available Market (TAM). Most TAMs are huge, but, if you are banking your business on the results – not just the outcome of a presentation – then be realistic. Too many companies make bad business decisions based on a PowerPoint deck showing a massive –but unreachable – TAM opportunity. Small to mid-sized B2B companies need to look at the SOM for near-term market size and the SAM for long-term market potential.
To complete your market viability check, conduct secondary research and primary research into each of the final end market candidates.
Secondary research includes publicly available information such as reading industry reports, conducting internet searches on competitors, reading trade publication articles, review SEC filings of public companies, identifying market size through finding companies of similar NAICS codes.
Primary research includes data you collect yourself such as interviews of industry experts, channel partners, and customers to evaluate market viability.
The final step is to compare the viability of each end market and select one to three to pursue. Create a master table that includes the market size (SOM and SAM), the calculated annual growth rate (CAGR) of the industry, alignment with your company’s core competencies, competitive strength, and the pocket income percent for each market.
Once you have completed the pocket income and market viability exercises you will have a clear indication of where to point your commercial engine. Show your peers and leaders the process and the results, obtain company-wide alignment, and get after it.
Best of luck. Please send comments or questions, I’d be glad to answer.
Latest posts by Chip Burnham (see all)
- Value Pricing Retains Both Customers and Profits - November 14, 2018
- Voice of the Customer – Needs Research - October 17, 2018